Overview #
The Webhook Logs report allows you to monitor and debug webhook activity within the system. It shows detailed information about each request sent to external endpoints, including whether it succeeded, failed, or is still pending. This report is especially useful for troubleshooting integrations and validating data delivery.
What You Can See #
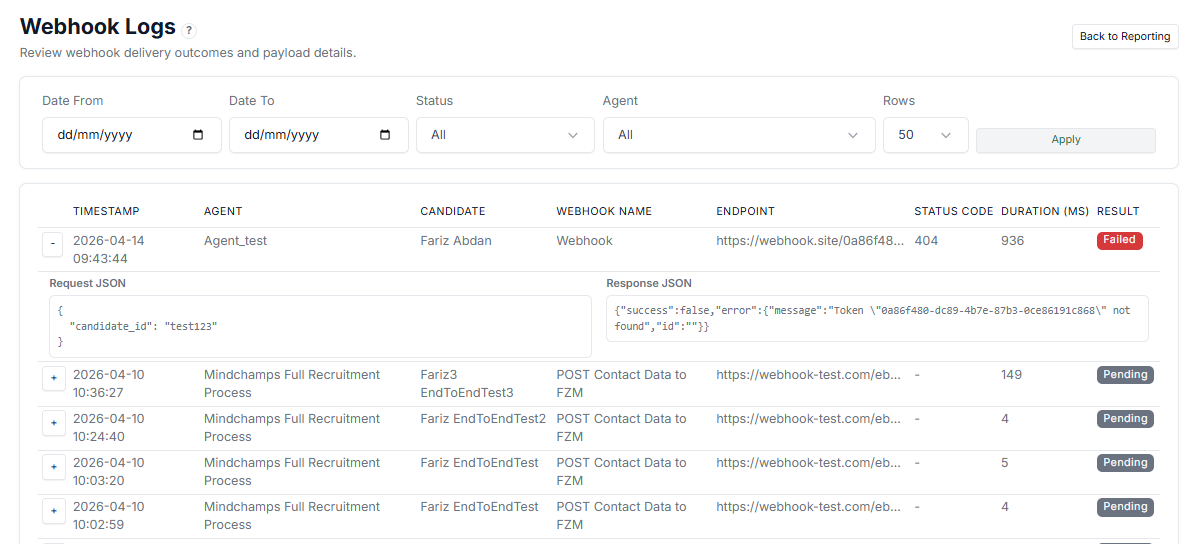
Each log entry includes:
- Timestamp — Date and time the webhook was triggered
- Agent — The Agent associated with the webhook
- Candidate — The related Candidate
- Webhook Name — Name of the webhook action
- Endpoint — The destination URL where data was sent
- Status Code — HTTP response code (e.g., 200, 404)
- Duration (ms) — Time taken for the request
- Result — Status of the request: Failed, Pending, or Success
Expanded View (Details) #
You can expand each log to see:
- Request JSON — The data sent to the webhook
- Response JSON — The response returned by the endpoint
This is critical for debugging issues.
Filters #
You can filter logs by:
- Date range
- Status
- Agent
- Number of rows
Helps narrow down specific events or errors.
How to Use Webhook Logs #
Use this report to:
- Debug failed webhook requests
- Validate payload data being sent
- Check response from external systems
- Monitor integration health
- Track webhook activity over time
Use Cases #
- Investigate failed API integrations
- Verify if Candidate data is sent correctly
- Troubleshoot incorrect or missing responses
- Monitor external system reliability
Tips #
- Check Status Code and Result first when debugging
- Expand logs to inspect request and response details
- Filter by Failed to quickly find issues
- Use Duration to identify slow endpoints