Overview #
The Agent Efficiency report allows you to analyse how Candidates move through a specific Agent's Journey. It helps identify bottlenecks, measure Step performance, and understand how long Candidates spend at each stage. This report is typically accessed by selecting an Agent or by clicking an Agent name from the Agent Comparison report.
How to Access It #
- Go to Reporting → Agent Efficiency
- Select an Agent from the dropdown
- Click Load
Or:
- Click an Agent Name from the Agent Comparison report
What You Can See #
The report is divided into three main sections:
1. Journey Distribution (Vertical Mountain View) #
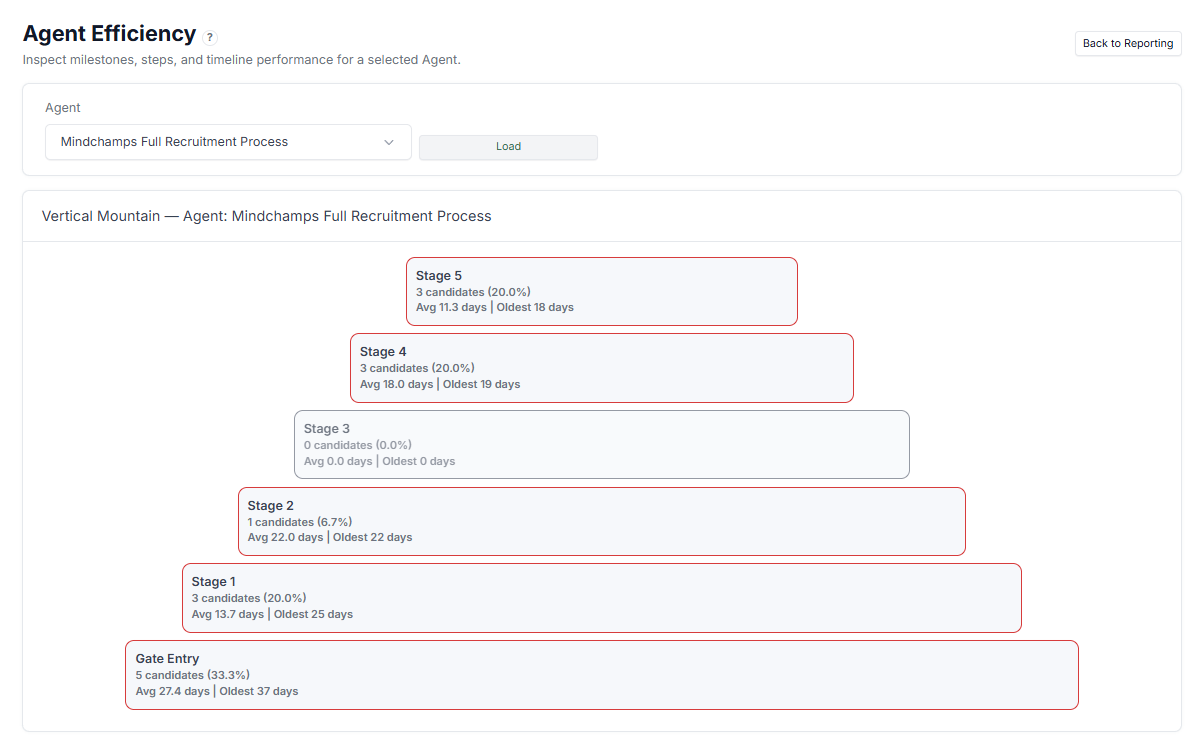
A visual representation of how Candidates are distributed across stages:
- Number of Candidates per stage
- Percentage distribution
- Average time spent in each stage
- Oldest Candidate in each stage
Helps you quickly identify where Candidates are concentrated.
2. Step Performance #
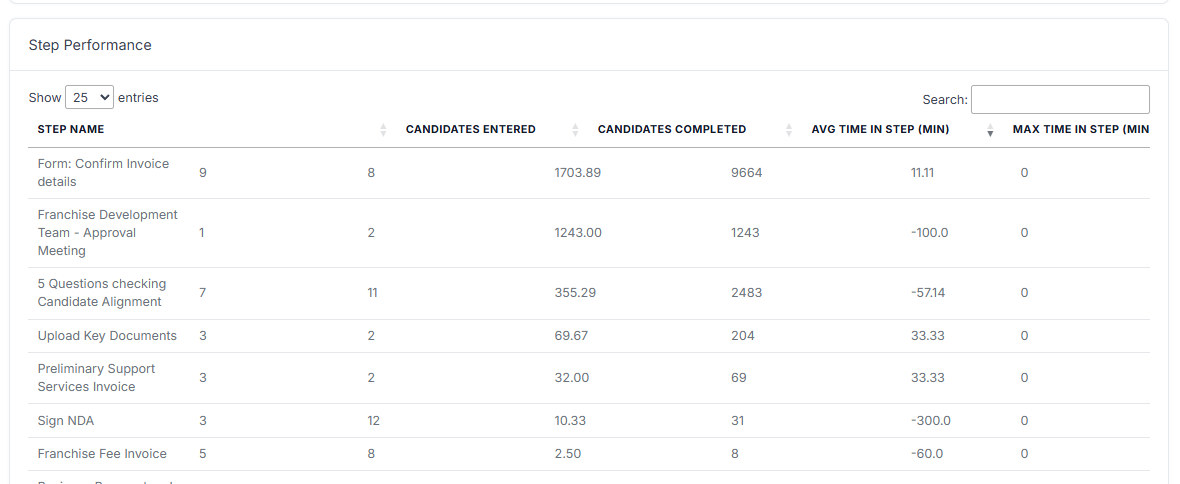
Detailed breakdown of each Step:
- Candidates Entered
- Candidates Completed
- Avg Time in Step (minutes)
- Max Time in Step (minutes)
Use this to evaluate how each Step performs and detect slow or problematic Steps.
3. Journey Timeline #
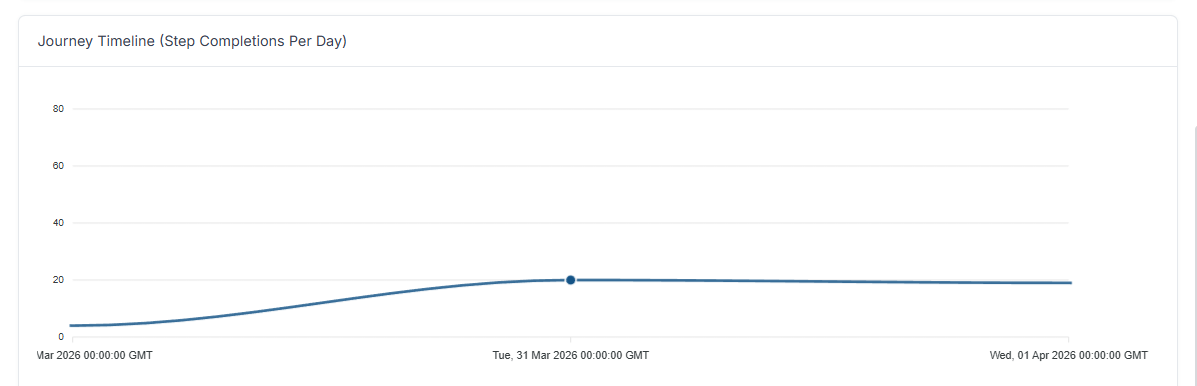
- Step completions over time (per day)
Helps track activity trends and identify peaks or slow periods.
How to Use Agent Efficiency #
Use this report to:
- Identify bottlenecks in specific stages
- Analyse how long Candidates spend in each Step
- Detect inefficient or slow Steps
- Monitor activity trends over time
- Optimise the overall Journey flow
Use Cases #
- Investigate why Candidates are delayed in a specific stage
- Improve Step design or instructions
- Measure operational efficiency of a workflow
- Track performance after making changes to an Agent
Tips #
- Focus on stages with high average days or large Candidate volume
- Compare entered vs completed to detect drop-offs
- Watch for unusually high max time in Step
- Use timeline trends to identify activity spikes or gaps