Overview #
The Gate Comparison report helps you evaluate how different sources (such as forms, websites, or campaigns) contribute to your Candidate pipeline. It allows you to compare not only the number of Candidates coming from each Gate, but also how well those Candidates progress through the Journey.
What You Can See #
The report is divided into two main sections:
1. Top Gates by Candidate Volume #
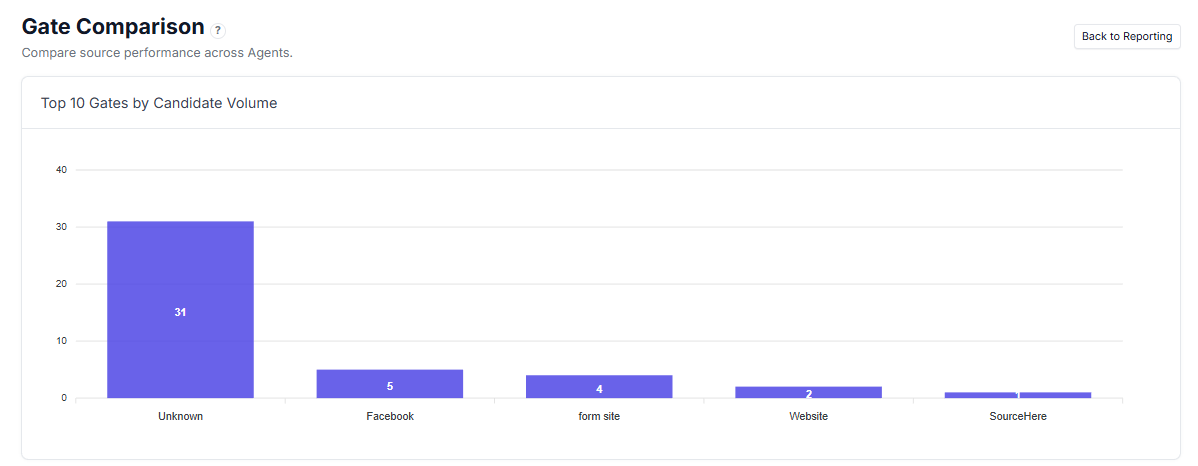
A visual chart showing:
- Number of Candidates entering from each Gate
- Relative comparison between sources
Helps quickly identify your main traffic or lead sources.
2. Gate Performance Table #
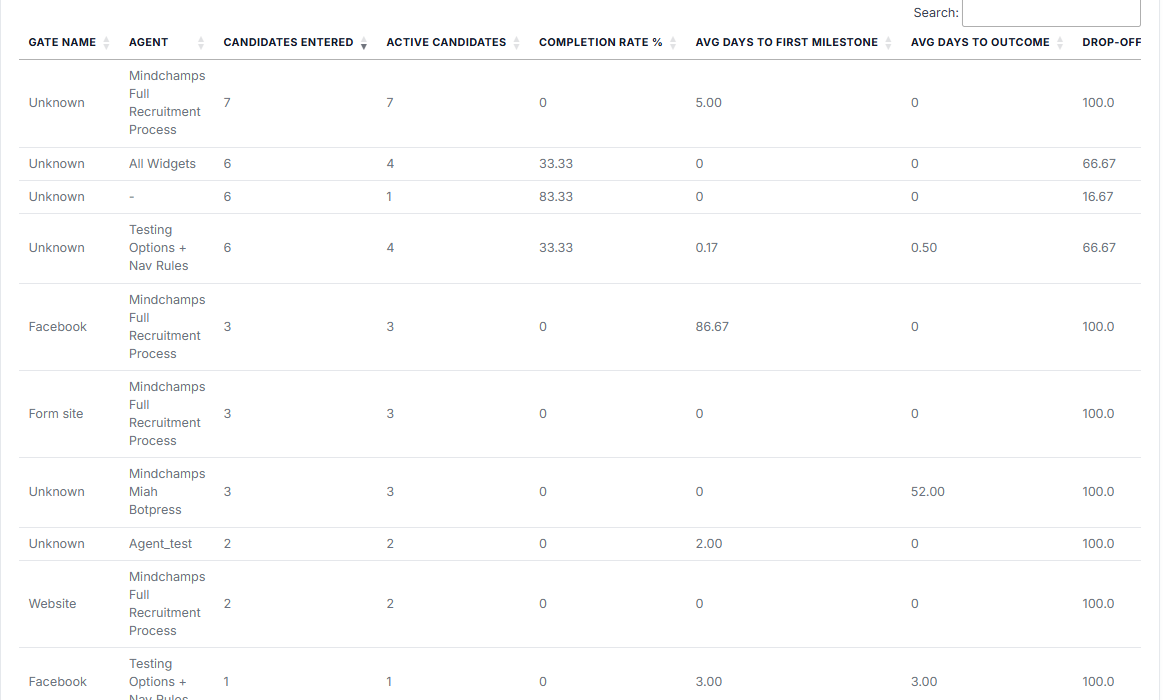
Detailed breakdown per Gate and Agent:
- Gate Name — Source of the Candidate (e.g., Facebook, Website, Form)
- Agent — The Agent receiving Candidates from that Gate
- Candidates Entered — Total number of Candidates from that source
- Active Candidates — Candidates still in progress
- Completion Rate % — Percentage of Candidates who completed the Journey
- Avg Days to First Milestone — How long it takes Candidates to reach the first stage
- Avg Days to Outcome — Average time to completion
- Drop-off % — Percentage of Candidates who did not complete the Journey
How to Use Gate Comparison #
Use this report to:
- Evaluate which sources bring the most Candidates
- Compare quality of Candidates across different Gates
- Identify sources with high drop-off rates
- Measure how quickly Candidates progress from each source
- Optimise marketing or lead generation channels
Use Cases #
- Compare Facebook vs Website performance
- Identify low-quality lead sources
- Optimise campaign targeting
- Improve conversion from specific entry points
Tips #
- High volume does not always mean high quality
- Focus on Completion Rate and Drop-off % together
- Check Avg Days to First Milestone to measure responsiveness
- Investigate Gates with high drop-off for possible issues