Overview #
Custom Grids let you build your own reports by selecting specific data, applying filters, and choosing which fields to display. This feature is useful when standard reports are not enough and you need more control over the data you want to analyse or export.
How It Works #
Custom Grids are built using four main sections:
1. Select Object & Saved Reports #
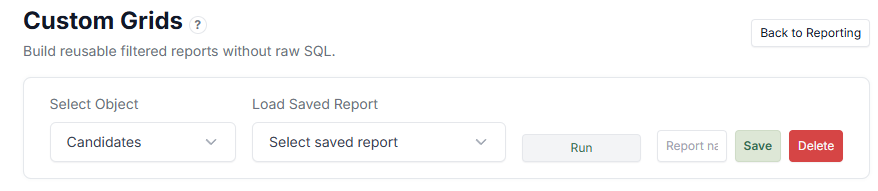
- Select Object — Choose what type of data you want to report on (e.g., Candidates)
- Load Saved Report — Load previously saved configurations
- Run — Execute the report based on selected filters and columns
- Save / Delete — Save your report setup for reuse or remove it
This section controls what data you are working with.
2. Filters #
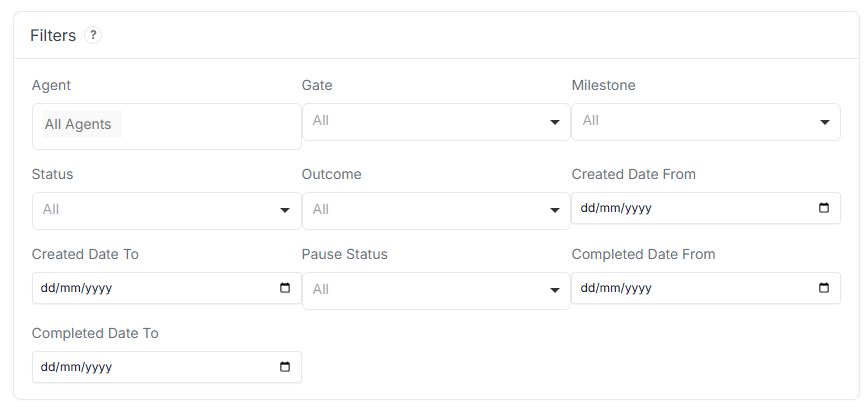
Filters allow you to narrow down the data:
- Agent
- Gate
- Milestone
- Status
- Outcome
- Created Date (From / To)
- Completed Date (From / To)
- Pause Status
Use filters to focus only on relevant Candidates or activity.
3. Columns #
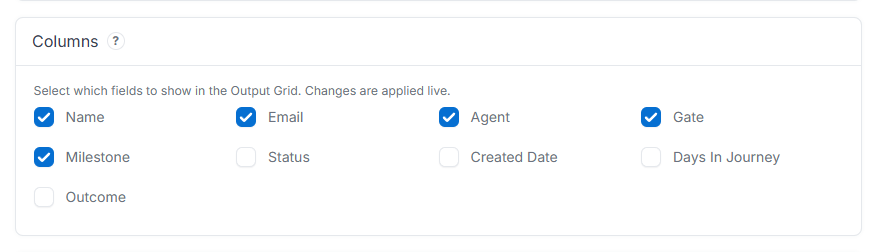
Select which fields will appear in the output:
- Name
- Agent
- Gate
- Milestone
- Status
- Created Date
- Days in Journey
- Outcome
Only selected fields will be shown in the results.
4. Output Grid #
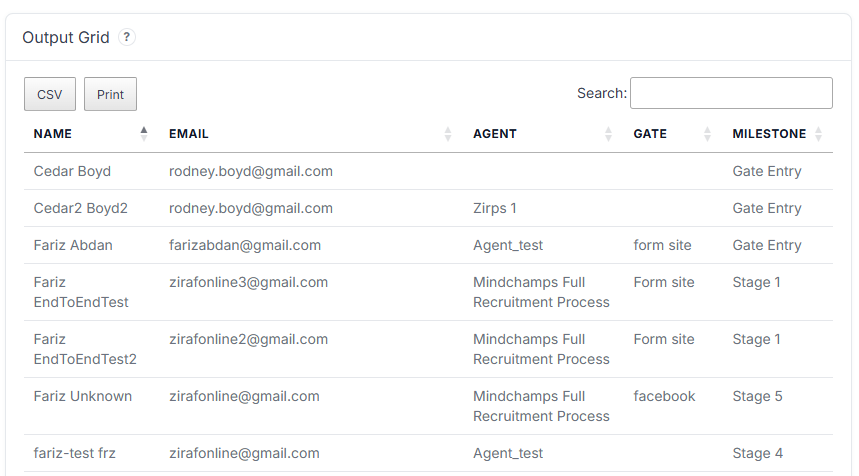
Displays the result of your report:
- Table view of filtered data
- Search within results
- Export options:
- CSV download
This is your final report output.
How to Use Custom Grids #
Typical workflow:
- Select an object (e.g., Candidates).
- Apply filters to narrow data.
- Choose columns to display.
- Click Run.
- (Optional) Save the report for future use.
Use Cases #
- Export Candidate lists for reporting
- Track Candidates in specific stages
- Analyse performance by Agent or Gate
- Monitor paused or completed Journeys
Tips #
- Start with minimal filters, then refine
- Save frequently used reports to save time
- Use Days in Journey to identify delays
- Combine filters (e.g., Agent + Milestone) for deeper insights