Overview #
The Helicopter View report gives a summarised, top-down perspective of how Candidates are distributed across Journey stages. Instead of focusing on detailed Step performance, this view helps you quickly understand where Candidates are concentrated and identify potential bottlenecks in the process. Each Agent is displayed separately, making it easy to compare overall flow performance.
What You Can See #
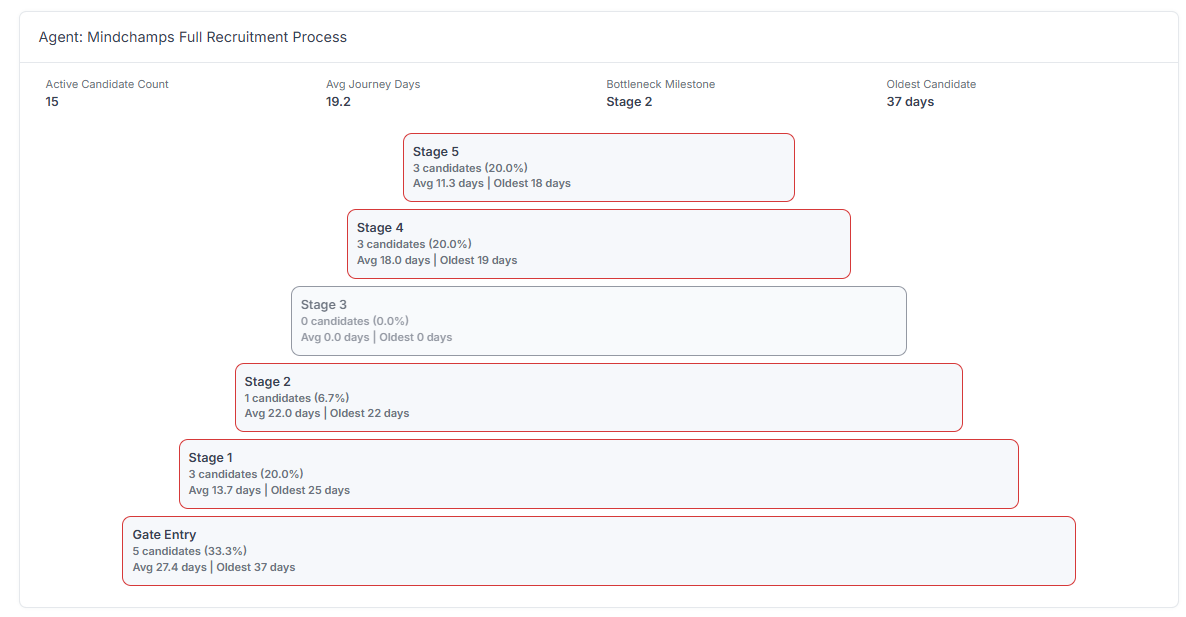
- Active Candidate Count — Total number of Candidates currently in the Journey
- Average Journey Days — Average time Candidates spend in the Journey
- Bottleneck Milestone — The stage where Candidates are most delayed
- Oldest Candidate — The longest time a Candidate has been in the Journey
Journey Distribution View #
The visual layout shows:
- Each stage or Milestone in the Journey
- Number and percentage of Candidates in each stage
- Average and oldest duration per stage
Larger blocks indicate where most Candidates are concentrated.
How to Use Helicopter View #
Use this report to:
- Quickly identify bottlenecks in the Journey
- Understand overall Candidate flow
- Compare performance across Agents
- Spot stages where Candidates are stuck
- Monitor Journey health at a glance
Use Cases #
- Detect delays in specific stages (e.g., Stage 2 bottleneck)
- Compare multiple Agents' performance visually
- Identify uneven distribution of Candidates
- Support high-level operational decision-making
Tips #
- Focus on stages with the highest Candidate concentration
- Check the Bottleneck Milestone for quick diagnosis
- Compare average vs oldest duration to detect stagnation
- Use this view together with Agent Efficiency for deeper analysis