Overview #
The Dashboard provides a high-level view of your activity across all Agents. It helps you quickly understand system usage, Candidate flow, and identify bottlenecks in your Journeys.
What You Can See on the Dashboard #
The Dashboard is divided into several key sections:
1. Key Metrics (Top Summary) #
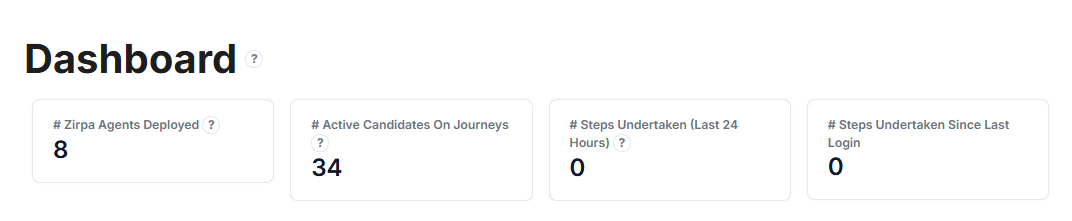
- Agents Deployed — Total number of active Agents in the system
- Active Candidates on Journeys — Number of Candidates currently progressing through Journeys
- Steps Undertaken (Last 24 Hours) — Total actions completed by Candidates in the past 24 hours
- Steps Undertaken Since Last Login — Activity since your last session
These metrics give a quick snapshot of system activity.
2. Candidate Trends (Charts) #
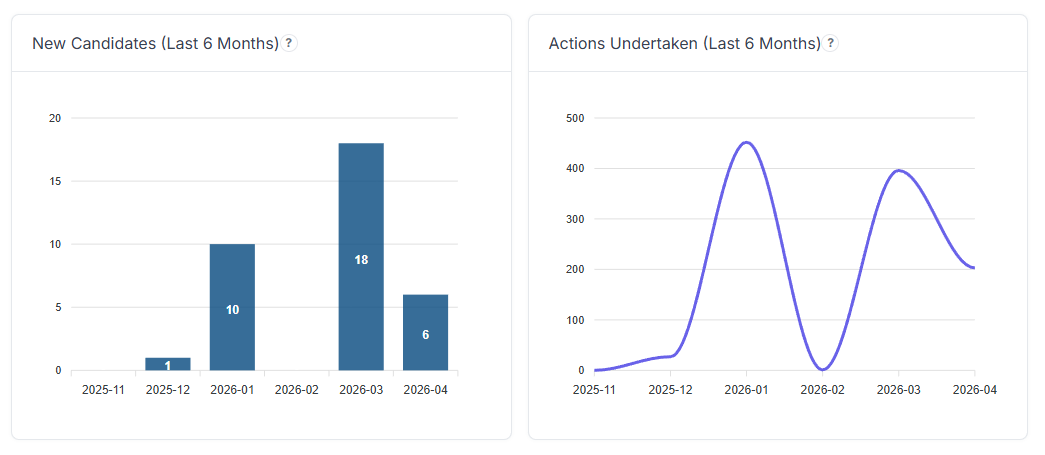
- New Candidates (Last 6 Months) — Shows how many new Candidates entered the system over time
- Actions Undertaken (Last 6 Months) — Displays total Candidate activity (Steps completed) over time
Useful for spotting growth trends and engagement patterns.
3. Latest Candidates #
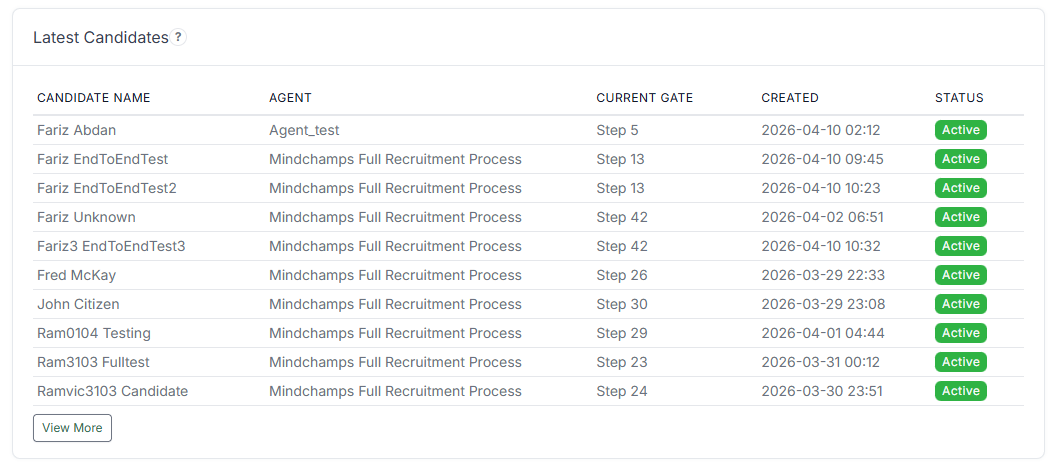
Displays the most recently added Candidates, including:
- Candidate Name
- Assigned Agent
- Current Step (Gate)
- Created Date
- Status
Helps you monitor recent entries and activity.
4. Candidates in Pause & Review #
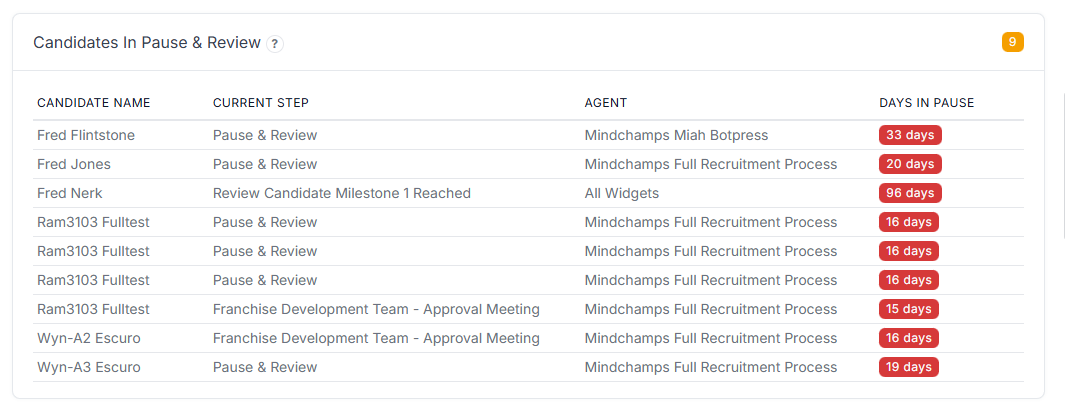
Shows Candidates who are currently paused or require manual review:
- Current Step
- Assigned Agent
- Days in Pause
Useful to identify stalled Candidates or delays.
5. Agent Performance Overview #
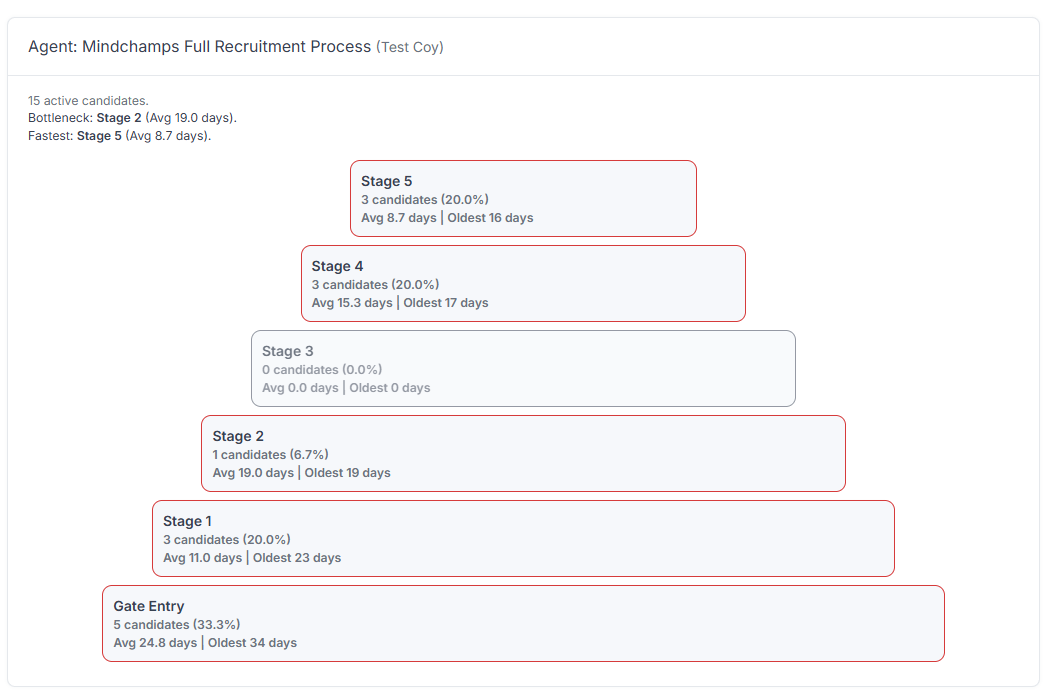
Each Agent has its own visual breakdown showing:
- Number of active Candidates
- Distribution across stages
- Average time spent per stage
- Oldest Candidate in each stage
Some Agents also highlight:
- Bottleneck stage
- Fastest stage
Helps identify inefficiencies and optimise the Journey.
How to Use the Dashboard #
Use the Dashboard to:
- Monitor overall system activity
- Identify bottlenecks and delays
- Track Candidate flow across Agents
- Compare performance between Agents
- Observe trends over time
Tips #
- Regularly check Pause & Review to prevent backlog
- Focus on stages with high average duration
- Use charts to compare growth vs activity
- Review Agent breakdowns to improve workflows